Vi’s Measured Mobile Speeds Exceed Declared Benchmarks Across All Telecom Circles for July 2026
Vodafone Idea met key TRAI network quality benchmarks across all 22 circles in July 2026, while 80th-percentile broadband speeds varied significantly across regions.
India’s leading telecom operator, Vodafone Idea (Vi), recorded strong network performance in July 2026, according to data compiled under the Telecom Regulatory Authority of India’s (TRAI) Quality of Service framework. The operator met most benchmark parameters across its 22 licensed service areas, even as broadband download speeds varied sharply from region to region, with Himachal Pradesh recording the weakest performance in the country.
On core network availability, Vi comfortably met the regulatory benchmark of 99 percent working cells across all circles, reporting 100 percent availability in every service area.
Cumulative downtime, which measures cells unavailable for service, remained within the prescribed 1.5 percent ceiling everywhere, ranging from a low of 0.07 percent in Kerala to a high of 0.61 percent in the North East circle.
The share of worst-affected cells due to downtime also remained within limits across the board, ranging from 0.11 percent in Kerala to 1.31 percent in Mumbai, against a permissible cap of 1.5 percent.
No significant network outages lasting more than four hours were reported in any district, with all circles achieving full compliance with timely outage reporting to the regulator.
Vi Voice Connection Establishment
Call setup performance was equally steady. Intra-network call setup success rates, benchmarked at a minimum of 98 percent, ranged from 99.08 percent in Karnataka to a perfect 100 percent in Jammu and Kashmir, Maharashtra and Goa.
Inter-service-provider call setup success rates, measured against a 95 percent threshold, were also met across all circles, with Himachal Pradesh posting the strongest figure at 99.96 percent.
Point of Interconnection (PoI) congestion remained at zero percent nationwide, well within the 0.5 percent regulatory limit, indicating no bottlenecks in inter-operator call handovers.
On network quality indicators for both circuit-switched and packet-switched services, Vi stayed within the prescribed 2 percent drop-call distribution thresholds in nearly all circles, though several regions — including Himachal Pradesh, Jammu and Kashmir, Gujarat and the North East — edged close to or touched the upper limits on specific measures.
Downlink and uplink packet drop rates for 4G/5G networks remained largely within the 2 percent benchmark across circles.
Latency figures, required to stay under 50 milliseconds, ranged from a swift 17.50 milliseconds in Kolkata to 42.05 milliseconds in Odisha, with all circles comfortably meeting the standard. Packet drop rate on 4G/5G networks stayed near zero in most circles, with Karnataka recording the highest figure at 0.41 percent, still within the 2 percent ceiling.
Typical Download/Upload Speed for Tariff Offerings
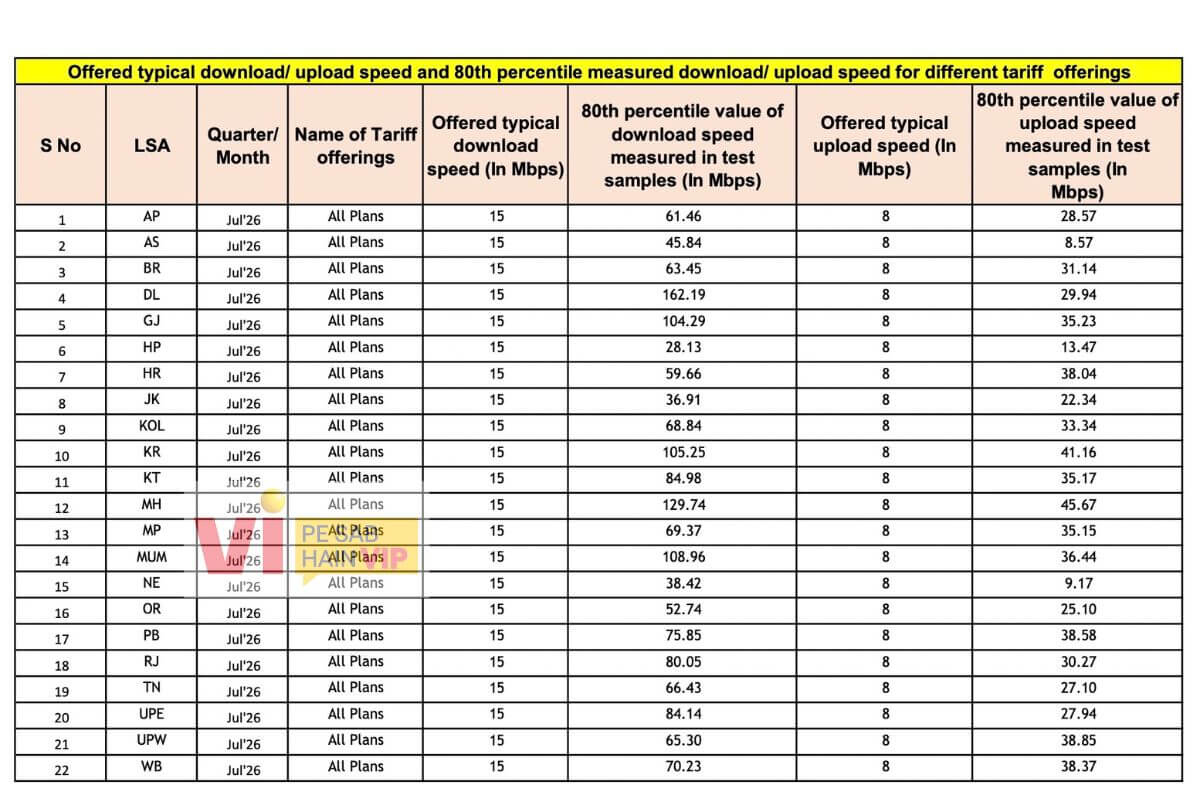
Across major circles, the operator recorded strong network availability metrics alongside consistent call connection metrics. In high-density commercial hubs like Delhi (DL) and Mumbai (MUM), the carrier demonstrated significant data capacity. For instance, Delhi registered an 80th percentile measured download speed of 162.19 Mbps against an offered typical download speed of 15 Mbps, while Mumbai posted a strong 80th percentile download speed of 108.96 Mbps.
Regional circles also reflected competitive delivery standards. Gujarat (GJ) and Kerala (KR) recorded robust 80th percentile download speeds of 104.29 Mbps and 105.25 Mbps, respectively, well above baseline configurations. Meanwhile, upload speeds remained stable nationwide, with most circles comfortably sustaining 80th percentile performance brackets between 8.57 Mbps and 45.67 Mbps.
80th Percentile Measured Download and Upload Speed for All Tariff Offerings
The internet speed data, however, revealed the widest disparities in the report. Against an offered typical download speed of 15 Mbps and an upload speed of 8 Mbps across all tariff plans, the 80th-percentile download and upload speeds measured in test samples (in Mbps) were as follows:
Andhra Pradesh: 61.46 Mbps download and 28.57 Mbps upload
Assam: 45.84 Mbps download and 8.57 Mbps upload
Bihar: 63.45 Mbps download and 31.14 Mbps upload
Delhi: 162.19 Mbps download and 29.94 Mbps upload
Gujarat: 104.29 Mbps download and 35.23 Mbps upload
Himachal Pradesh: 28.13 Mbps download and 13.47 Mbps upload
Haryana: 59.66 Mbps download and 38.04 Mbps upload
Jammu & Kashmir: 36.91 Mbps download and 22.34 Mbps upload
Kolkata: 68.84 Mbps download and 33.34 Mbps upload
Kerala: 105.25 Mbps download and 41.16 Mbps upload
Karnataka: 84.98 Mbps download and 35.17 Mbps upload
Maharashtra & Goa: 129.74 Mbps download and 45.67 Mbps upload
Mumbai: 108.96 Mbps download and 36.44 Mbps upload
North East: 38.42 Mbps download and 9.17 Mbps upload
Odisha: 52.74 Mbps download and 25.10 Mbps upload
Punjab: 75.85 Mbps download and 38.58 Mbps upload
Rajasthan: 80.05 Mbps download and 30.27 Mbps upload
Tamil Nadu: 66.43 Mbps download and 27.10 Mbps upload
Uttar Pradesh (East): 84.14 Mbps download and 27.94 Mbps upload
Uttar Pradesh (West): 65.30 Mbps download and 38.85 Mbps upload
West Bengal: 70.23 Mbps download and 38.37 Mbps upload
The 80th-percentile download speed is a regulatory compliance metric defined by the Telecom Regulatory Authority of India (TRAI). Under TRAI’s Quality of Service (QoS) regulations, telecom operators must measure and report the 80th percentile of their delivered data speeds.
The 80th-percentile value indicates that at least 80 percent of the measured test samples recorded download and upload speeds equal to or greater than the “offered typical download and upload speeds” stated in the service tariff.
 Support Telecomtalk